




















Quick Answer
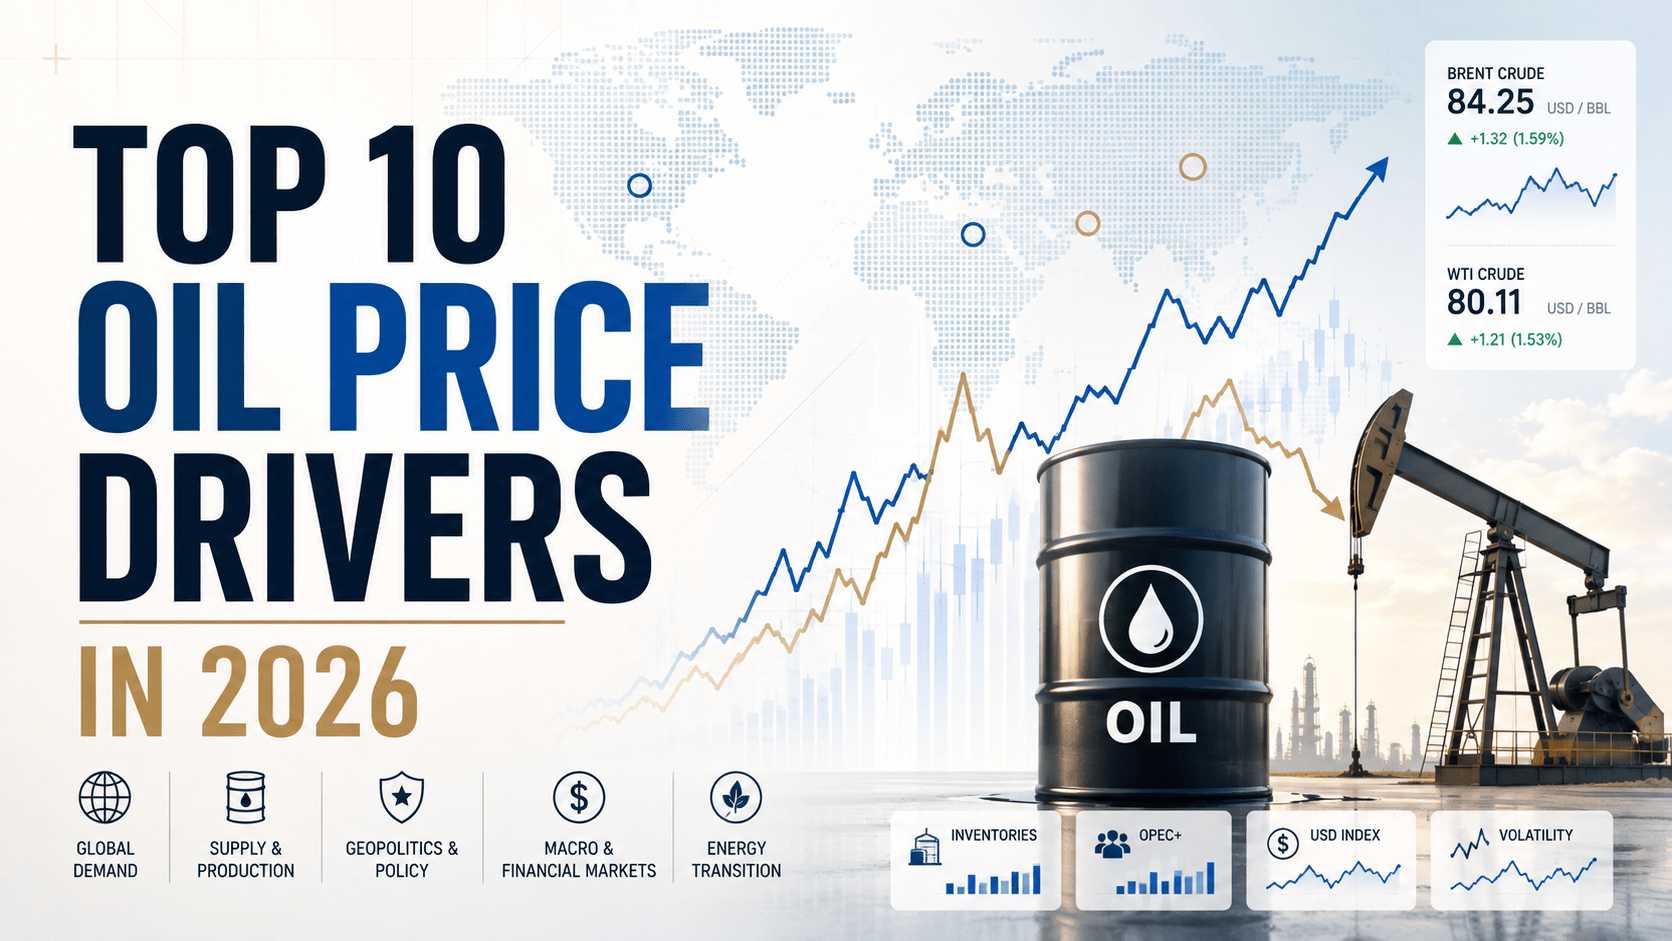
Oil prices in 2026 are being shaped by the interaction of geopolitical supply risk, OPEC+ production policy, non-OPEC output growth, uneven global demand, inventory swings, refining constraints, the U.S. dollar and interest rates, futures-market positioning, seasonal weather, and the slow-moving shift toward electrification. No single headline, an OPEC+ statement, a weekly inventory print, is enough evidence for a trade. The most useful signal is usually a change in expectations, not any one data point in isolation.
Key Takeaways
- Forecasters disagree sharply on 2026 demand, which is itself informative: track revisions, not one agency’s base case.
- The U.S. Energy Information Administration’s July 2026 Short-Term Energy Outlook put Brent averaging around $82 per barrel for the year, easing toward roughly $70 in the fourth quarter as supply normalizes, a steep downgrade from its June outlook, reflecting how fast these forecasts move.
- OPEC+ policy, non-OPEC supply growth, and inventory data form the “physical” layer of analysis; the dollar, rates, and futures positioning form the “financial” layer. Strong trading signals appear when both layers agree.
- Instrument choice (futures, ETFs, or crypto-margined perpetuals) changes an investor’s risk profile as much as the price view itself.
What Is Driving Oil Prices in 2026?
Physical supply and demand set the baseline; financial markets then amplify or dampen that baseline based on positioning, the dollar, and rate expectations. In 2026, the gap between these two layers has been wide. The EIA’s July outlook cut its 2026 Brent forecast from roughly $95 to about $82 in a single monthly revision, largely because a Strait of Hormuz disruption earlier in the year eased faster than expected. That kind of swing shows why investors should treat any single forecast as a snapshot, not a prediction.
Below is a quick-reference table, followed by a closer look at each driver.
| Driver | Bullish signal | Bearish signal | Best source | Check how often |
| Geopolitical disruptions | Falling tanker flows, verified outages | Normalized shipping, restored output | EIA, tanker-tracking data | Daily |
| OPEC+ policy | Cuts, strong compliance | Quota increases, overproduction | OPEC | Monthly |
| Non-OPEC supply | Delays, outages, capex cuts | Faster-than-expected growth | EIA, national agencies | Monthly |
| Global demand | Strong mobility, industrial activity | Demand destruction, recession signs | IEA, OPEC, IMF | Monthly |
| Inventories | Sustained stock draws | Stock builds | EIA, IEA | Weekly/monthly |
| Refining | Strong margins, high utilization | Outages, weak runs | EIA, IEA | Weekly |
| Dollar and rates | Weaker dollar, easier policy | Stronger dollar, restrictive rates | Federal Reserve | Daily/monthly |
| Futures market | Backwardation, rising net length | Contango, liquidation | CME, CFTC | Daily/weekly |
| Weather | Disruptive storms, extreme temperatures | Mild, disruption-free season | NOAA | Seasonal |
| Energy transition | Slow substitution | Faster EV/efficiency gains | IEA | Quarterly |
1. Geopolitical Conflicts and Transit Chokepoints
Prices move most durably when a conflict removes physical barrels rather than just raises headline risk. The Strait of Hormuz, Bab el-Mandeb, Suez Canal, and Russian export infrastructure are the chokepoints to watch, since Hormuz alone typically carries roughly a fifth of global oil demand. Investors should separate political threats from verified shipment reductions, and crude disruptions from refined-product disruptions — the two don’t always move together.
2. OPEC+ Production Decisions and Compliance
OPEC+ moves prices through both its announced targets and the market’s confidence that members will actually hit them. On August 2, 2026, seven core OPEC+ members, Saudi Arabia, Russia, Iraq, Kuwait, Kazakhstan, Algeria, and Oman, agreed to a further 188,000 barrel-per-day production adjustment for September, continuing a gradual unwind of the 2023 voluntary cuts. Investors should weight actual exports and secondary-source production estimates more heavily than announced quotas, since several members have historically produced below their new ceilings.
3. U.S. Shale and Other Non-OPEC Supply
Non-OPEC growth, led by the United States, Brazil, Canada, Guyana, and Argentina, can cap rallies by replacing barrels withheld elsewhere. Shale responds quickly to price signals through drilling and completion activity, while offshore projects add larger volumes on multi-year timelines. Watch producer capital-expenditure guidance for the earliest read on future supply.
4. Global Growth and Demand in China, India, and the U.S.
This is where forecasts diverge most. Some agencies see global demand contracting modestly in 2026 as high prices and slower growth weigh on consumption; others see continued, if slower, growth. Rather than picking a side, track the underlying evidence: Chinese crude imports and refinery runs, Indian fuel sales, U.S. gasoline consumption, and global jet-fuel demand. Divergent growth paths in China and India mean the two countries won’t necessarily move oil demand in the same direction at the same time.
5. Commercial Inventories and Strategic Reserves
Inventories reveal whether the market is genuinely tight or well-supplied once production and consumption are netted out. A single weekly EIA print can mislead due to trade flows and refinery maintenance, so compare four-week trends, adjust for seasonality, and check stock levels against their five-year range. Strategic reserve releases add supply immediately but can create future demand when governments restock.
6. Refining Capacity and Crack Spreads
Crude can look well-supplied while gasoline, diesel, or jet fuel stays tight, because refineries, not oil fields, are sometimes the binding constraint. A crack spread is simply the difference between the value of refined products and the crude used to make them; wide spreads encourage refiners to run harder, supporting crude demand, while outages do the opposite even when fuel prices are firm. Confirm any crude-price signal against both refinery utilization and product inventories before acting on it.
7. The Dollar, Interest Rates, and Inflation
Oil is priced internationally in dollars, so a stronger greenback raises costs for non-dollar buyers, all else equal. The Federal Reserve held its target range at 3.50%–3.75% on July 29, 2026, citing elevated uncertainty tied in part to Middle East tensions, a reminder that energy shocks and monetary policy are feeding into each other this cycle. Higher oil prices can complicate the inflation picture and delay rate cuts, while tighter policy can eventually cool the demand that supports oil prices. This relationship isn’t stable in every regime, so treat it as a lean, not a rule.


8. Futures Curves, Positioning, and Instrument Choice
The futures curve shows whether traders are pricing near-term scarcity or future surplus. Backwardation, near-term contracts priced above later ones — often signals tightness; contango often reflects surplus and storage costs. Beyond direction, the instrument used to express a view materially changes the risk:
| Instrument | Access | Key risks | Best suited for |
| Exchange-traded WTI/Brent futures | Requires futures account, margin | Leverage, rollover timing, exchange rules | Investors wanting standardized, regulated contracts |
| Oil ETFs | Brokerage account | Rollover/contango drag, tracking error | Investors wanting simple, no-margin exposure |
| USDT-margined perpetual futures | Crypto exchange account | Funding costs, liquidation, counterparty and platform risk | Crypto-native traders comfortable with derivatives risk |
Perpetual contracts, such as trade WTI/USDT futures product listed on exchanges like MEXC, let crypto-native traders take oil exposure without a traditional futures account, but they introduce funding-rate costs, liquidation risk, and platform/counterparty exposure that standardized futures don’t carry. Leverage offered on these products can run very high; that should be read strictly as a risk factor, not an advantage, and any use should be sized accordingly. Availability, margin rules, and regulatory treatment of such products vary by jurisdiction and platform, so investors should confirm local rules before trading any oil derivative.
9. Hurricanes and Seasonal Weather
Weather affects oil through three separate channels: Gulf of Mexico production outages, Gulf Coast refinery and port disruptions, and seasonal shifts in gasoline, diesel, and heating-fuel demand. Atlantic hurricane season runs roughly June through November, with peak activity typically August through October. A quieter seasonal outlook lowers average risk but doesn’t remove the tail risk of one storm hitting critical infrastructure, track storm paths and affected capacity, not just the seasonal storm count.
10. Electric Vehicles and Energy Policy
Electrification and efficiency gains reduce structural oil-demand growth, but the effect is gradual and uneven by region and transport segment. The IEA has estimated the global EV fleet displaces well over a million barrels a day of oil consumption, a figure that grows each year. High oil prices strengthen the economic case for switching; low prices can slow it. Aviation, petrochemicals, and heavy transport remain harder to electrify and continue to anchor demand even as light-duty EV adoption rises.
Decision Framework: Combining the Ten Drivers
Layer 1 — Confirm the physical balance. Start with production, exports, tanker flows, and inventories to see whether barrels are actually entering or leaving the market.
Layer 2 — Confirm demand and refining conditions. Use refinery runs, crack spreads, product stocks, and mobility data to check whether demand is absorbing available supply.
Layer 3 — Check market pricing and positioning. Use the futures curve, speculative positioning, the dollar, and rates to see whether the physical story is already priced in.
- Bull case: renewed supply disruption, OPEC+ discipline, falling inventories, strengthening backwardation.
- Base case: gradual flow normalization, uneven demand recovery, stabilizing inventories.
- Bear case: strong non-OPEC supply, continued OPEC+ production restoration, softer demand, developing contango.
The strongest signals appear when all three layers point the same way. Mixed signals, say, falling inventories alongside a strengthening dollar, usually call for smaller positions or none at all.
Conclusion: Track Revisions, Not Just Forecasts
No single driver reliably predicts where oil goes next, and 2026 has underlined that: the EIA’s own Brent forecast moved by roughly $13 a barrel between consecutive monthly outlooks. The most useful information is often the change — a revised demand forecast, an unexpected inventory swing, a shift in OPEC+ language, or a moving futures curve. Oil derivatives, and leveraged products especially, can produce losses as fast as gains, so position sizing and instrument choice deserve as much attention as the price call itself. This article is for informational purposes and isn’t investment, tax, or legal advice; rules on trading, margin, and derivatives access vary by jurisdiction.
FAQ
What is the biggest driver of oil prices right now?
No single factor dominates. Geopolitics, OPEC+ policy, and supply-demand data all influence prices.
Will oil prices go up or down in 2026?
Forecasts vary. As of the EIA’s July 2026 outlook, Brent was expected to average about $82 for the year before easing toward the $70 range by Q4.
How does OPEC+ affect oil prices?
OPEC+ influences prices through production targets and members’ compliance with them.
Is it better to trade oil futures or an oil ETF?
Futures offer direct exposure but require margin. ETFs are simpler but can face rollover costs. Crypto perpetuals have different funding and platform risks.
How does the U.S. dollar affect oil prices?
A stronger U.S. dollar generally weighs on oil demand by making crude more expensive in other currencies, though supply shocks can outweigh this effect.