























You can win seven times out of ten and still be down money at the end. That sounds wrong, but it follows from how expected value works. Expected value is the probability-weighted average of every outcome, with each outcome weighted by how likely it is (Statlect, Expected value). It is not a prediction of what will happen next, and it is not the result you are most likely to see. The gap between those two ideas is where money quietly goes.
By the end of this article you will be able to run the sum yourself on any two-outcome wager. If you would rather see the two-outcome example below worked through in an interface, Wild.io’s expected value calculator takes the same three inputs. Its fields are labelled in dollars rather than pounds; the arithmetic is identical, so the same numbers illustrate the hypothetical sterling example below. Checked on 7 October 2026, odds of 1.20, a stake of 50 and an estimated 70% win chance returned an expected value of -8.00, or -16%.
Key takeaways
- Expected value is the probability-weighted average of all possible outcomes, not the likeliest one.
- A high win rate can still be negative expected value, because loss size is weighted too.
- Four steps: list outcomes, assign probabilities that sum to 1, multiply, add the products.
- It is an average over repeats, not a forecast of one attempt.
- Inputs matter: a fair coin’s probability is known, while this article’s 70% is an assumption.
What does expected value actually measure?
It measures the average you would land on if the same situation repeated many times, with every outcome weighted by its probability. That average need not be a result you could ever observe. Statlect describes it as a weighted average of the possible realisations of a random variable, and notes the idea was devised in the 17th century to analyse gambling games (Statlect, Expected value).
Expected value is the probability-weighted average of every possible outcome, not the single most likely result. Newcastle University’s worked example of three coin tosses gives an expectation of 1.5 heads, a figure no actual run of three tosses can produce (Newcastle University, Expected Values). The average describes the long run, not the next attempt.
You can’t get half a head, and that’s the point. The figure is a centre of gravity for all the results, not a forecast of one of them.
Two housekeeping rules matter first. List every outcome that can happen, and check the probabilities add up to 1. If they don’t, something has been left out or counted twice.
Why can a 70% win chance still lose money?
Because a win rate tells you nothing about the size of what you win or lose. Weight both and the picture can flip.
Take a hypothetical wager. You put £50 at stake at decimal odds of 1.20. A win returns your £50 plus £10 net profit; a loss costs the whole £50. Say you judge the chance of winning at 70%, leaving 30% for the loss. The two add to 1, because there are only two outcomes.
| Outcome | Probability | Net result | Probability x net result |
| Win | 0.70 | +£10 | +£7 |
| Loss | 0.30 | -£50 | -£15 |
| Total | 1.00 | n/a | -£8 per attempt |
The hypothetical wager worked through: 70% of +£10 gives +£7, 30% of -£50 gives -£15, and together -£8 per attempt. Assumed figures, not measured.


So the sum is 0.70 x £10 – 0.30 x £50 = -£8 per attempt. Against the £50 at stake, that is -16%.
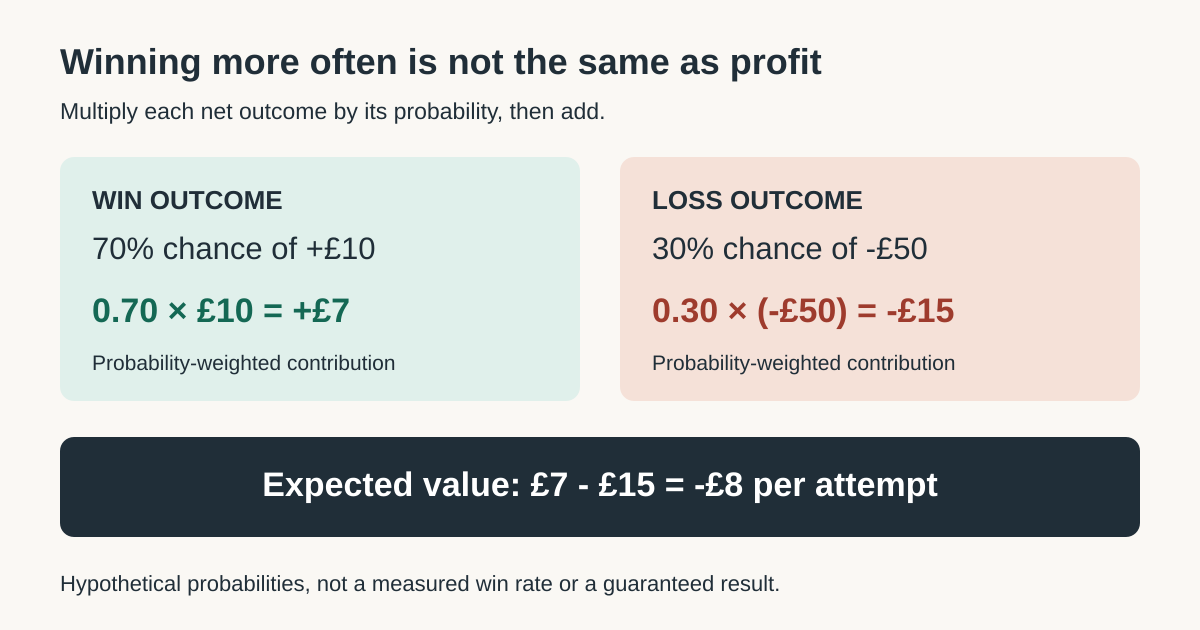
A high win rate does not make a wager favourable, because the size of the loss matters as much as its probability. On this hypothetical, a 70% chance of a £10 net win set against a 30% chance of losing the £50 at stake averages -£8 per attempt, or -16% of the amount staked.
Those probabilities are assumed for the sake of the sum. They are not a measured win rate, not a survey of real players, and not a forecast. Change the assumption and the answer changes, which is the reason to do the arithmetic rather than trust the feel of it.
How do you calculate expected value?
In four steps: list the outcomes, give each one a probability, multiply each outcome by its probability, then add the products.
- List every outcome. For a simple wager that is two, a win and a loss.
- Assign a probability to each. Written as decimals, they must sum to 1.
- Multiply each outcome by its probability. Use net results, not gross returns.
- Add the products. The total is the expected value per attempt.
In plain words for two outcomes: expected value equals the chance of winning times the net profit, minus the chance of losing times the amount lost. The formal discrete version is the one Newcastle University gives, where E[X] is the sum, across every value x, of x multiplied by P(X = x), the probability of that value (Newcastle University, Expected Values). Step 2 is where the whole calculation stands or falls, and the final section returns to why.
What changes when there are more than two outcomes?
Nothing changes in principle. You simply have more rows to add. Take a separate hypothetical with three outcomes: 20% returns +£40, 30% returns +£10, and 50% returns -£20. The probabilities add to 1. The contributions are +£8, +£3 and -£10, so the expected value is +£1 per attempt. Worth stating plainly: the two-outcome calculator linked earlier takes one win probability and one loss, so it will not handle a three-way split like this. That one is a job for paper or a spreadsheet.
What does a positive, negative or zero figure mean?
The sign tells you which side the average falls on. Positive means the average favours you, negative means it does not, and zero is the break-even line.
One trap comes first. In the £50 example a win returns £60 gross, which is your own £50 stake coming back plus £10 you did not have before. The £10 is the figure that belongs in the calculation. Putting £60 in would count your own stake as winnings and flatter the result badly.
Zero expected value marks the break-even probability. For this hypothetical wager that is 5/6, or about 83.3%. Below it the average is a loss, above it a gain.
| Assumed win probability | Expected value per attempt |
| 70% | -£8 |
| 80% | -£2 |
| About 83.3% | £0 |
| 85% | +£1 |
The £50 at stake and the £10 net win stay the same down every row. Only the assumed probability moves.
Now add a cost. Assume £2 goes on each attempt in fees or charges, an assumption rather than a published charge. At 85% the expected value was +£1 before costs. Subtract the assumed £2 and it becomes -£1. A thin positive edge is the easiest thing for costs to erase.
How is expected value different from probability and risk?
The three answer different questions. Probability asks how often. Expected value asks what the average result is. Risk asks how far from that average things can stray, and how bad the worst case gets.
The 85% version above averages +£1 per attempt. It also loses the whole £50 on the remaining 15% of attempts. A positive average does not mean an attempt cannot hurt. Expected value is not utility, not affordability, not the most likely outcome, and not a guarantee.
A positive expected value is an average over repeats under assumed inputs, not a promise. Averages add up cleanly: the expected value of a total across several separate attempts is the sum of their individual expected values (Statlect, Properties of the expected value). What does not add up cleanly is your experience of a short run.
Working out the figure that applies to you, rather than the one in the headline, is the same habit behind how everyday maths can work against household budgets. None of this is advice on whether to take a particular wager; it’s arithmetic you can run on your own assumptions.
What can an expected value calculation not tell you?
It cannot check the probability you feed it, and that is the input everything else depends on. For a fair coin or a balanced die the figure is known. Elsewhere it may rest on historical records, or on nothing firmer than a judgement, which is what the 70% in this article is. No calculator can verify a figure you typed in, including the one linked earlier.
It also cannot see costs and rules you leave out. The assumed £2 per attempt in the previous section was enough on its own to turn +£1 into -£1.
And it says little about the short run. An average across many repeats is not a description of ten attempts, or of one. Convergence towards that average needs assumptions to hold, including stable probabilities and attempts that do not influence one another. Repetition on its own does not make outcomes independent, so that assumption is worth checking rather than inheriting.
One claim deserves retiring: a run of losses does not make a win due. This article assumes 70% on every attempt, and attempts that do not influence each other. On those two assumptions the next attempt is 70% whatever came before. The assumption does that work, not the repetition. Where attempts can affect one another, a fixed overall win rate settles nothing about the next one.
Frequently asked questions
Can expected value be negative?
Yes. A negative figure means the average outcome is a loss under the assumptions used. In the hypothetical above it was -£8 per attempt, which is -16% of the £50 at stake. That is an average across repeats, not a loss that lands on any particular attempt.
Does a positive expected value guarantee a win?
No. It is an average under the inputs you assumed, so an individual attempt can still lose. The hypothetical 85% case averages +£1 per attempt and still loses the whole £50 on the remaining 15% of attempts. A positive average is not a promise of profit or safety.
Why can a high win rate still lose money?
Because the size of each loss is weighted as well as its chance. One infrequent large loss can outweigh many frequent small wins. Winning 70% of the time is no help when the losing 30% costs £50 against a £10 win.
Conclusion
Winning more often than you lose is not the same as coming out ahead. Expected value settles it, because it weighs the size of each outcome by its probability instead of counting how often each turns up. The method is short: list the outcomes, assign probabilities that sum to 1, multiply each outcome by its probability, add the products. The hypothetical wager running through this article wins seven times in ten and still averages -£8 per attempt, because the losing 30% costs £50 against a £10 win.
The arithmetic is the easy half. The figure is only ever as good as the probability you put into it, so that is the number worth arguing with.
Sources
- Statlect, Expected value, retrieved 7 October 2026, https://www.statlect.com/fundamentals-of-probability/expected-value
- Statlect, Properties of the expected value, retrieved 7 October 2026, https://www.statlect.com/fundamentals-of-probability/expected-value-properties
- Newcastle University Academic Skills Kit, Expected Values, retrieved 7 October 2026, https://www.mas.ncl.ac.uk/ask/numeracy-maths-statistics/statistics/descriptive-statistics/expected-values.html